Dark Mode Trading Journal Spreadsheet, Stock Crypto Trade Tracker, Win Rate, Day Trading Journal, Forex Trade Log, Excel Google Sheets
$4.99 USD
Buy on EtsyInstant digital download for Microsoft Excel and Google Sheets. Checkout and delivery are handled securely by Etsy.
Dark Mode Trading Journal Spreadsheet for Microsoft Excel and Google Sheets, instant digital download. A trading journal in dark mode, built to sit next to your charts: log trades on dark tabs and see your real stats on a dark dashboard. Perfect for stock, ETF, options, crypto, forex and futures traders.
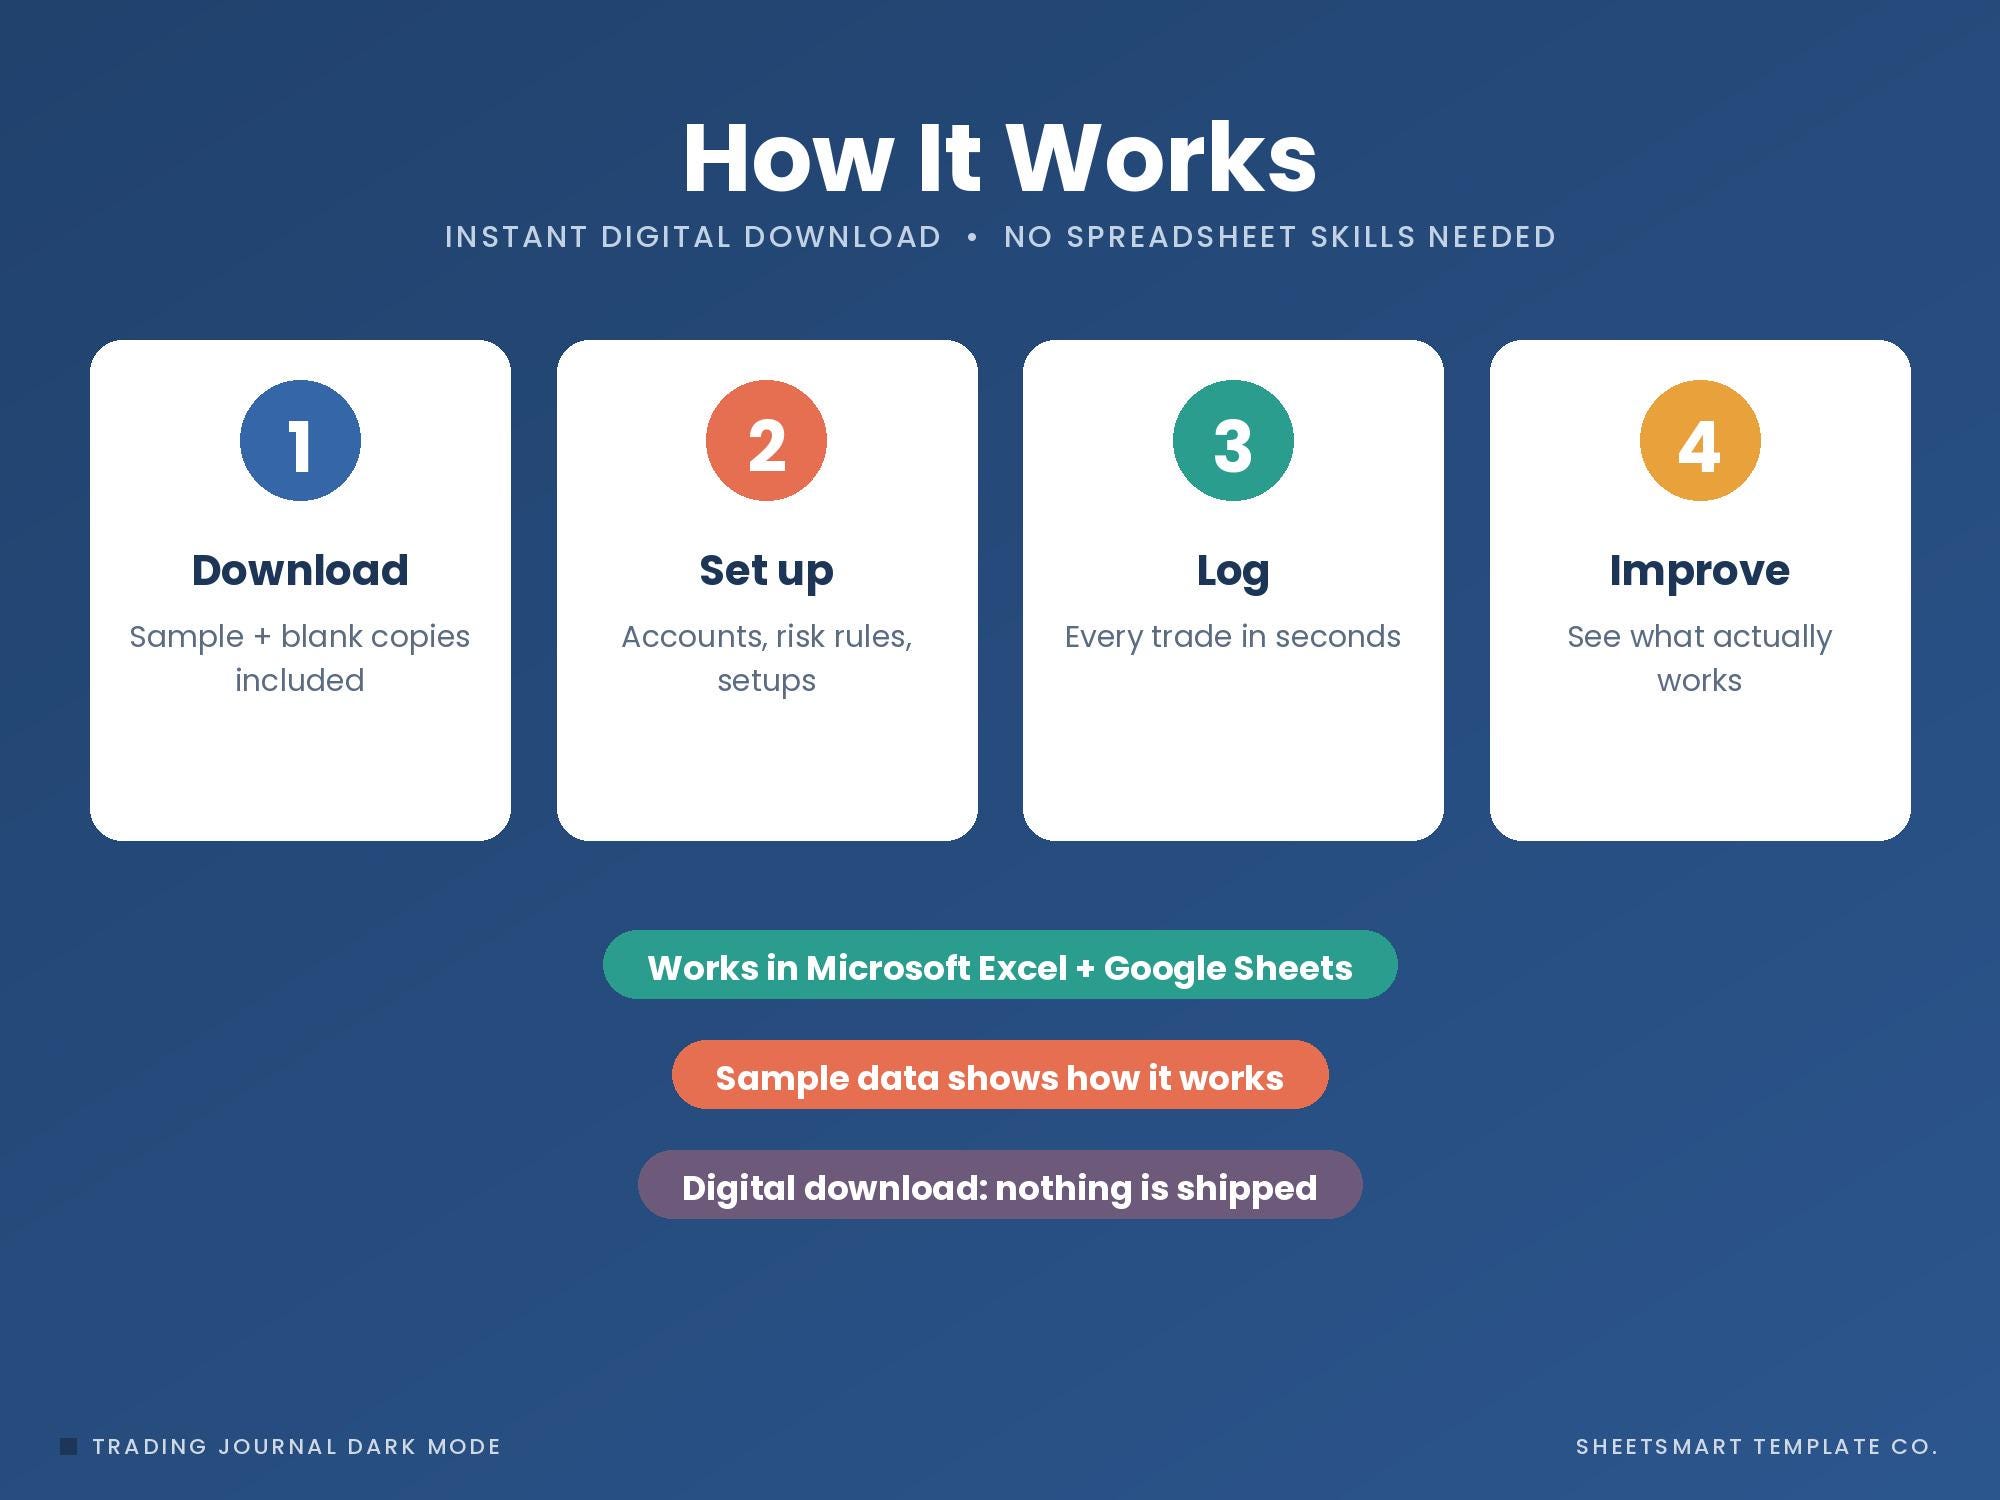
✨ NOW INCLUDES 4 FILES: a SAMPLE version (filled in so you can see exactly how it works) and a BLANK version (cleared and ready for your own info), each in an Excel edition and a Google Sheets edition.
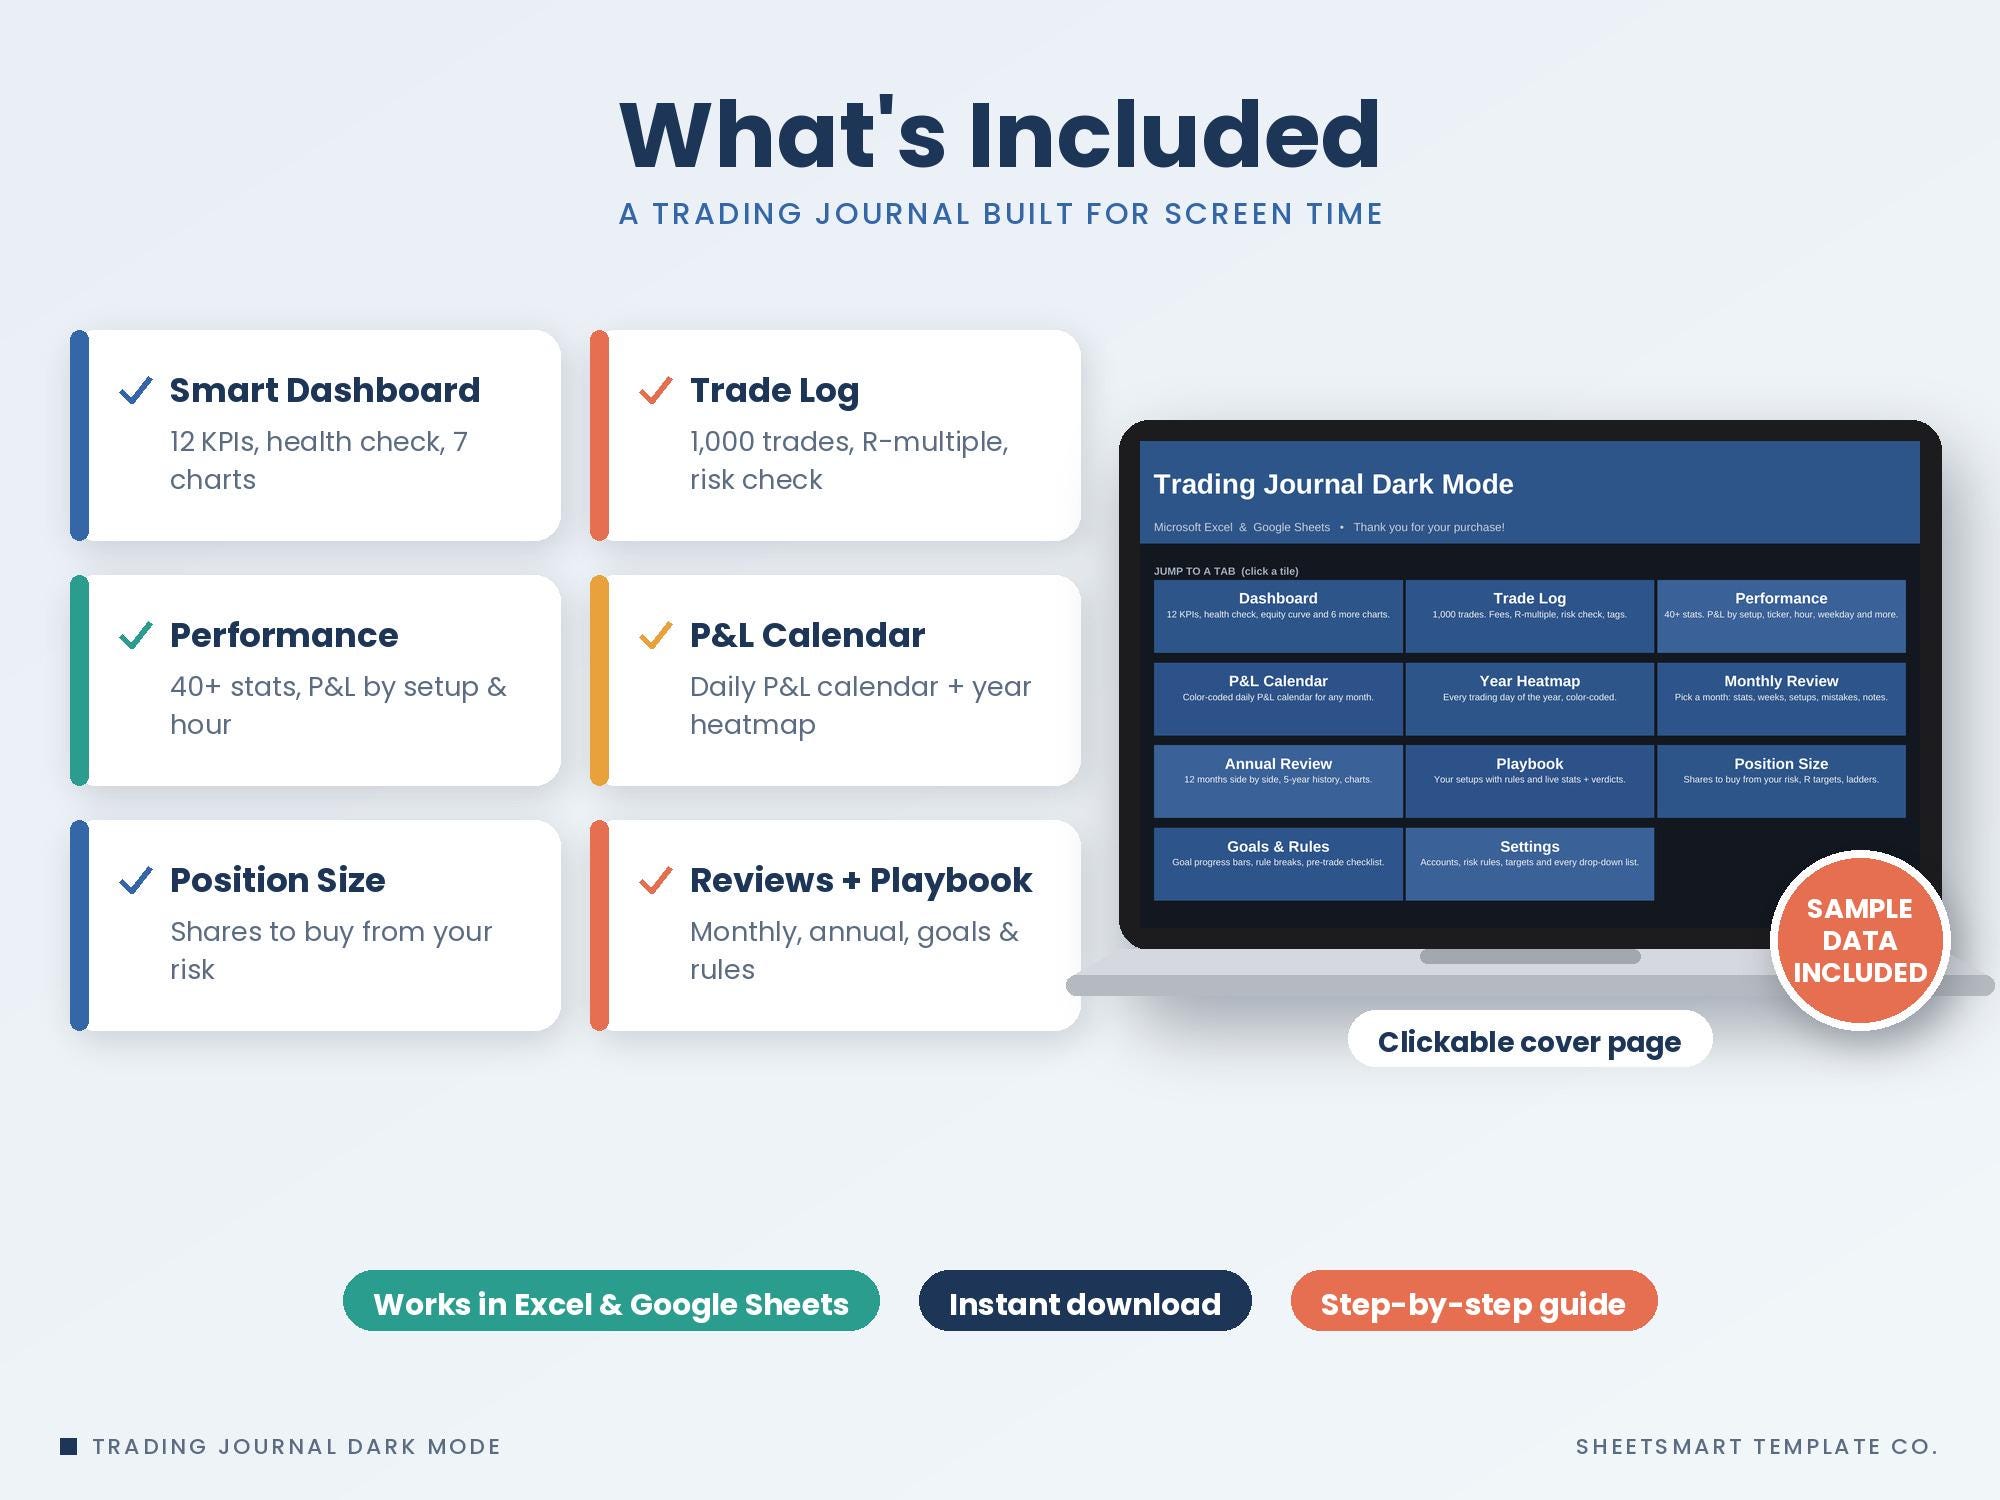
★ WHAT'S INCLUDED ★
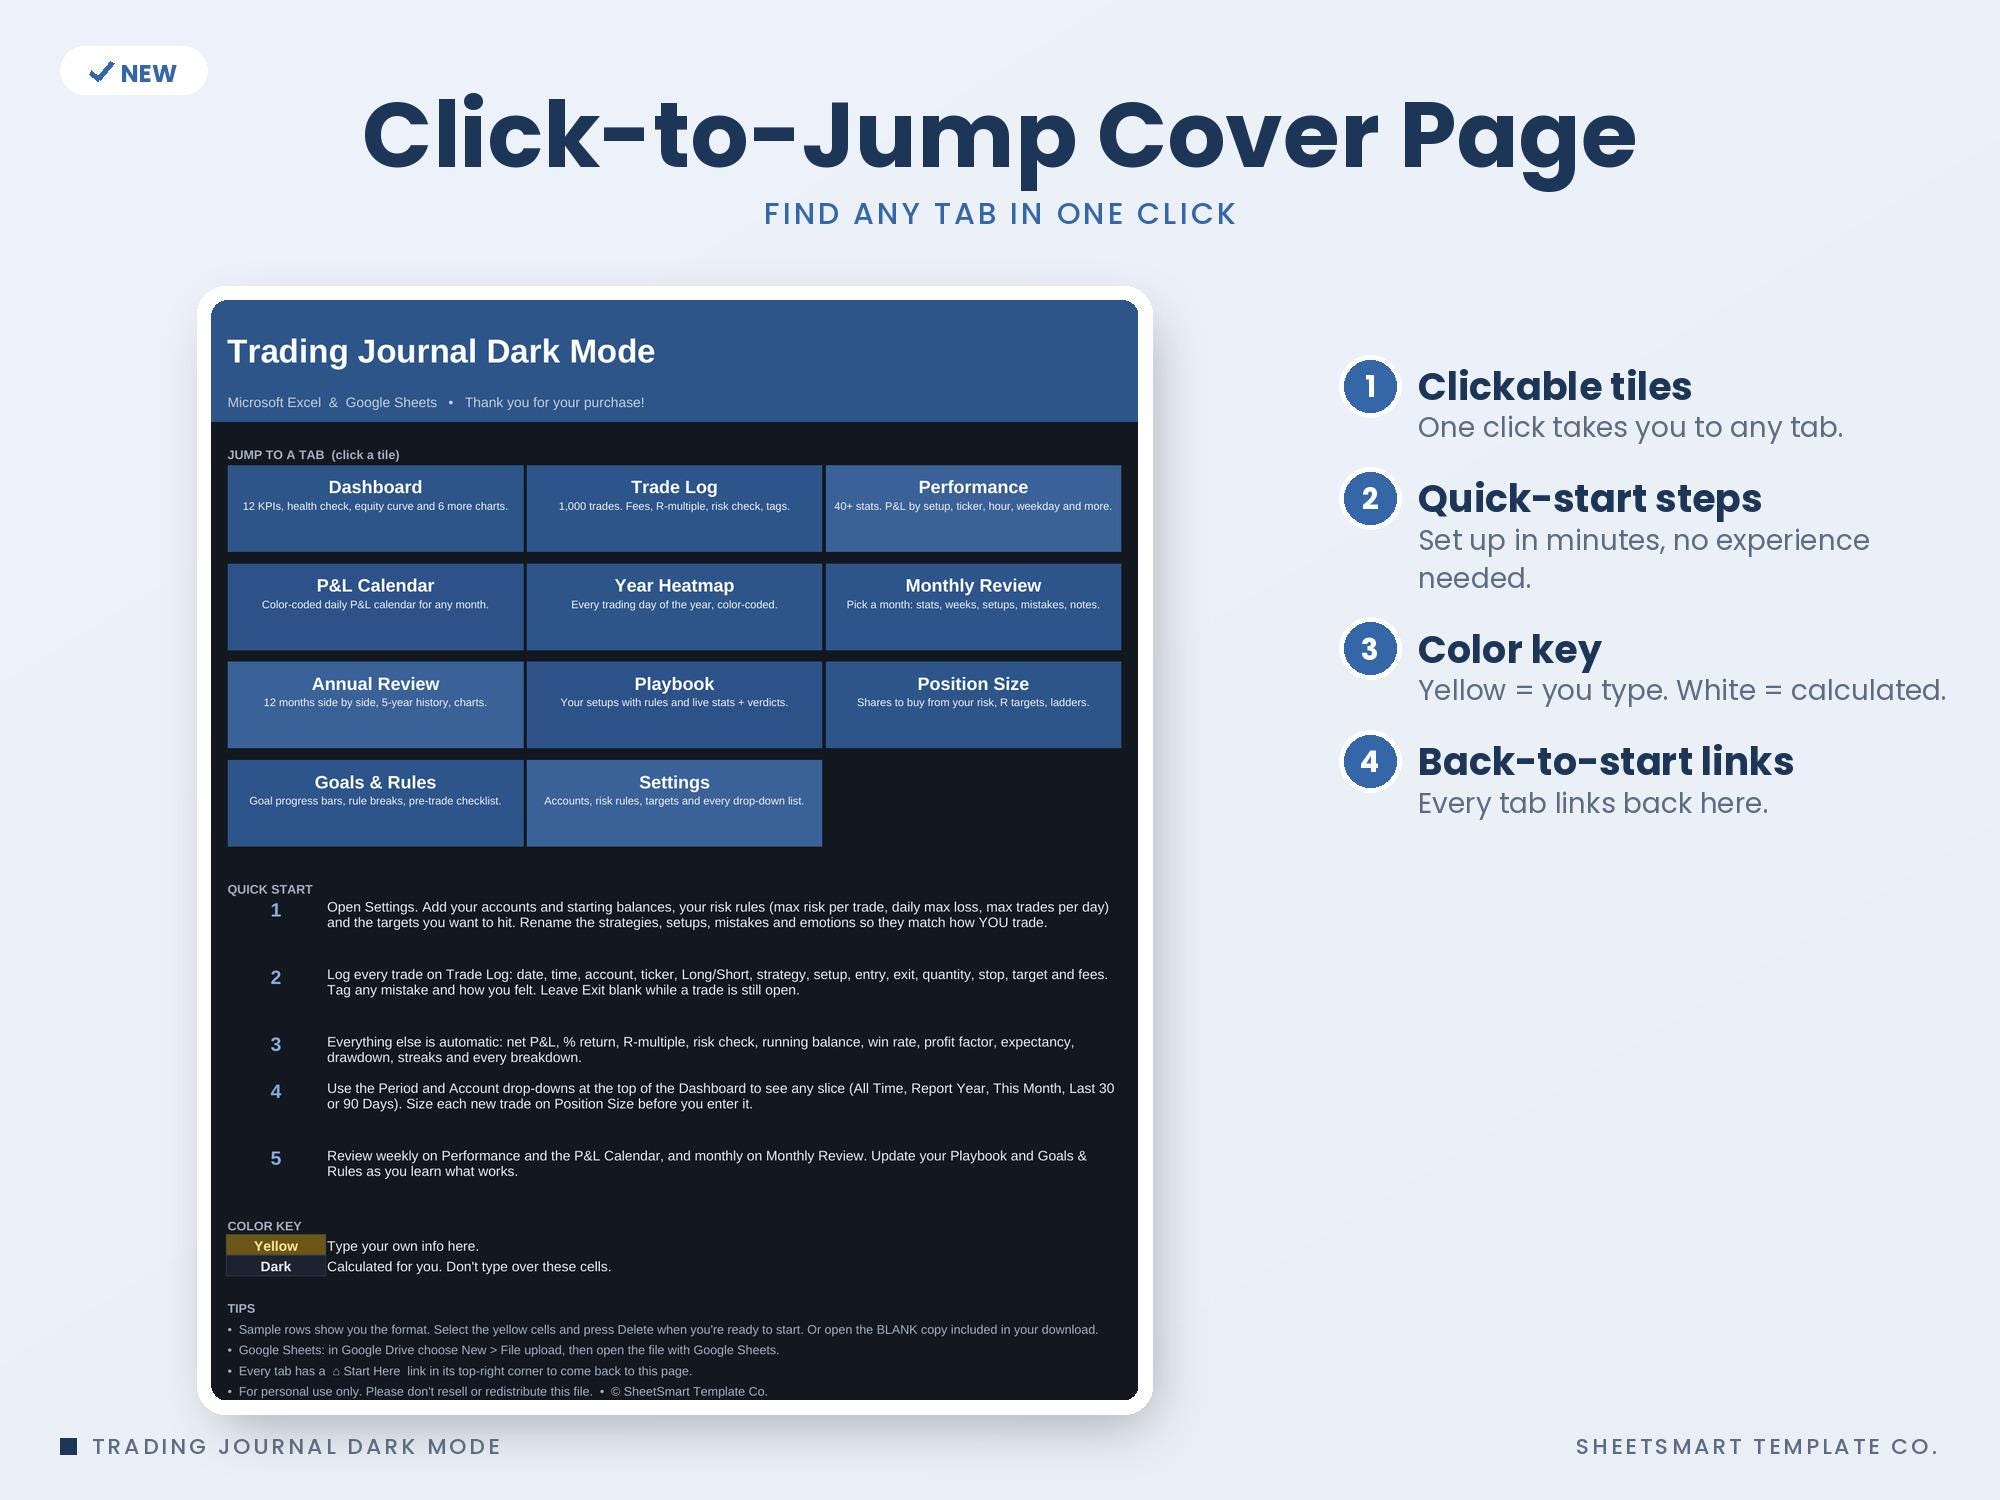
• Clickable Start Here cover page with quick-start steps and a color key (yellow = you type)
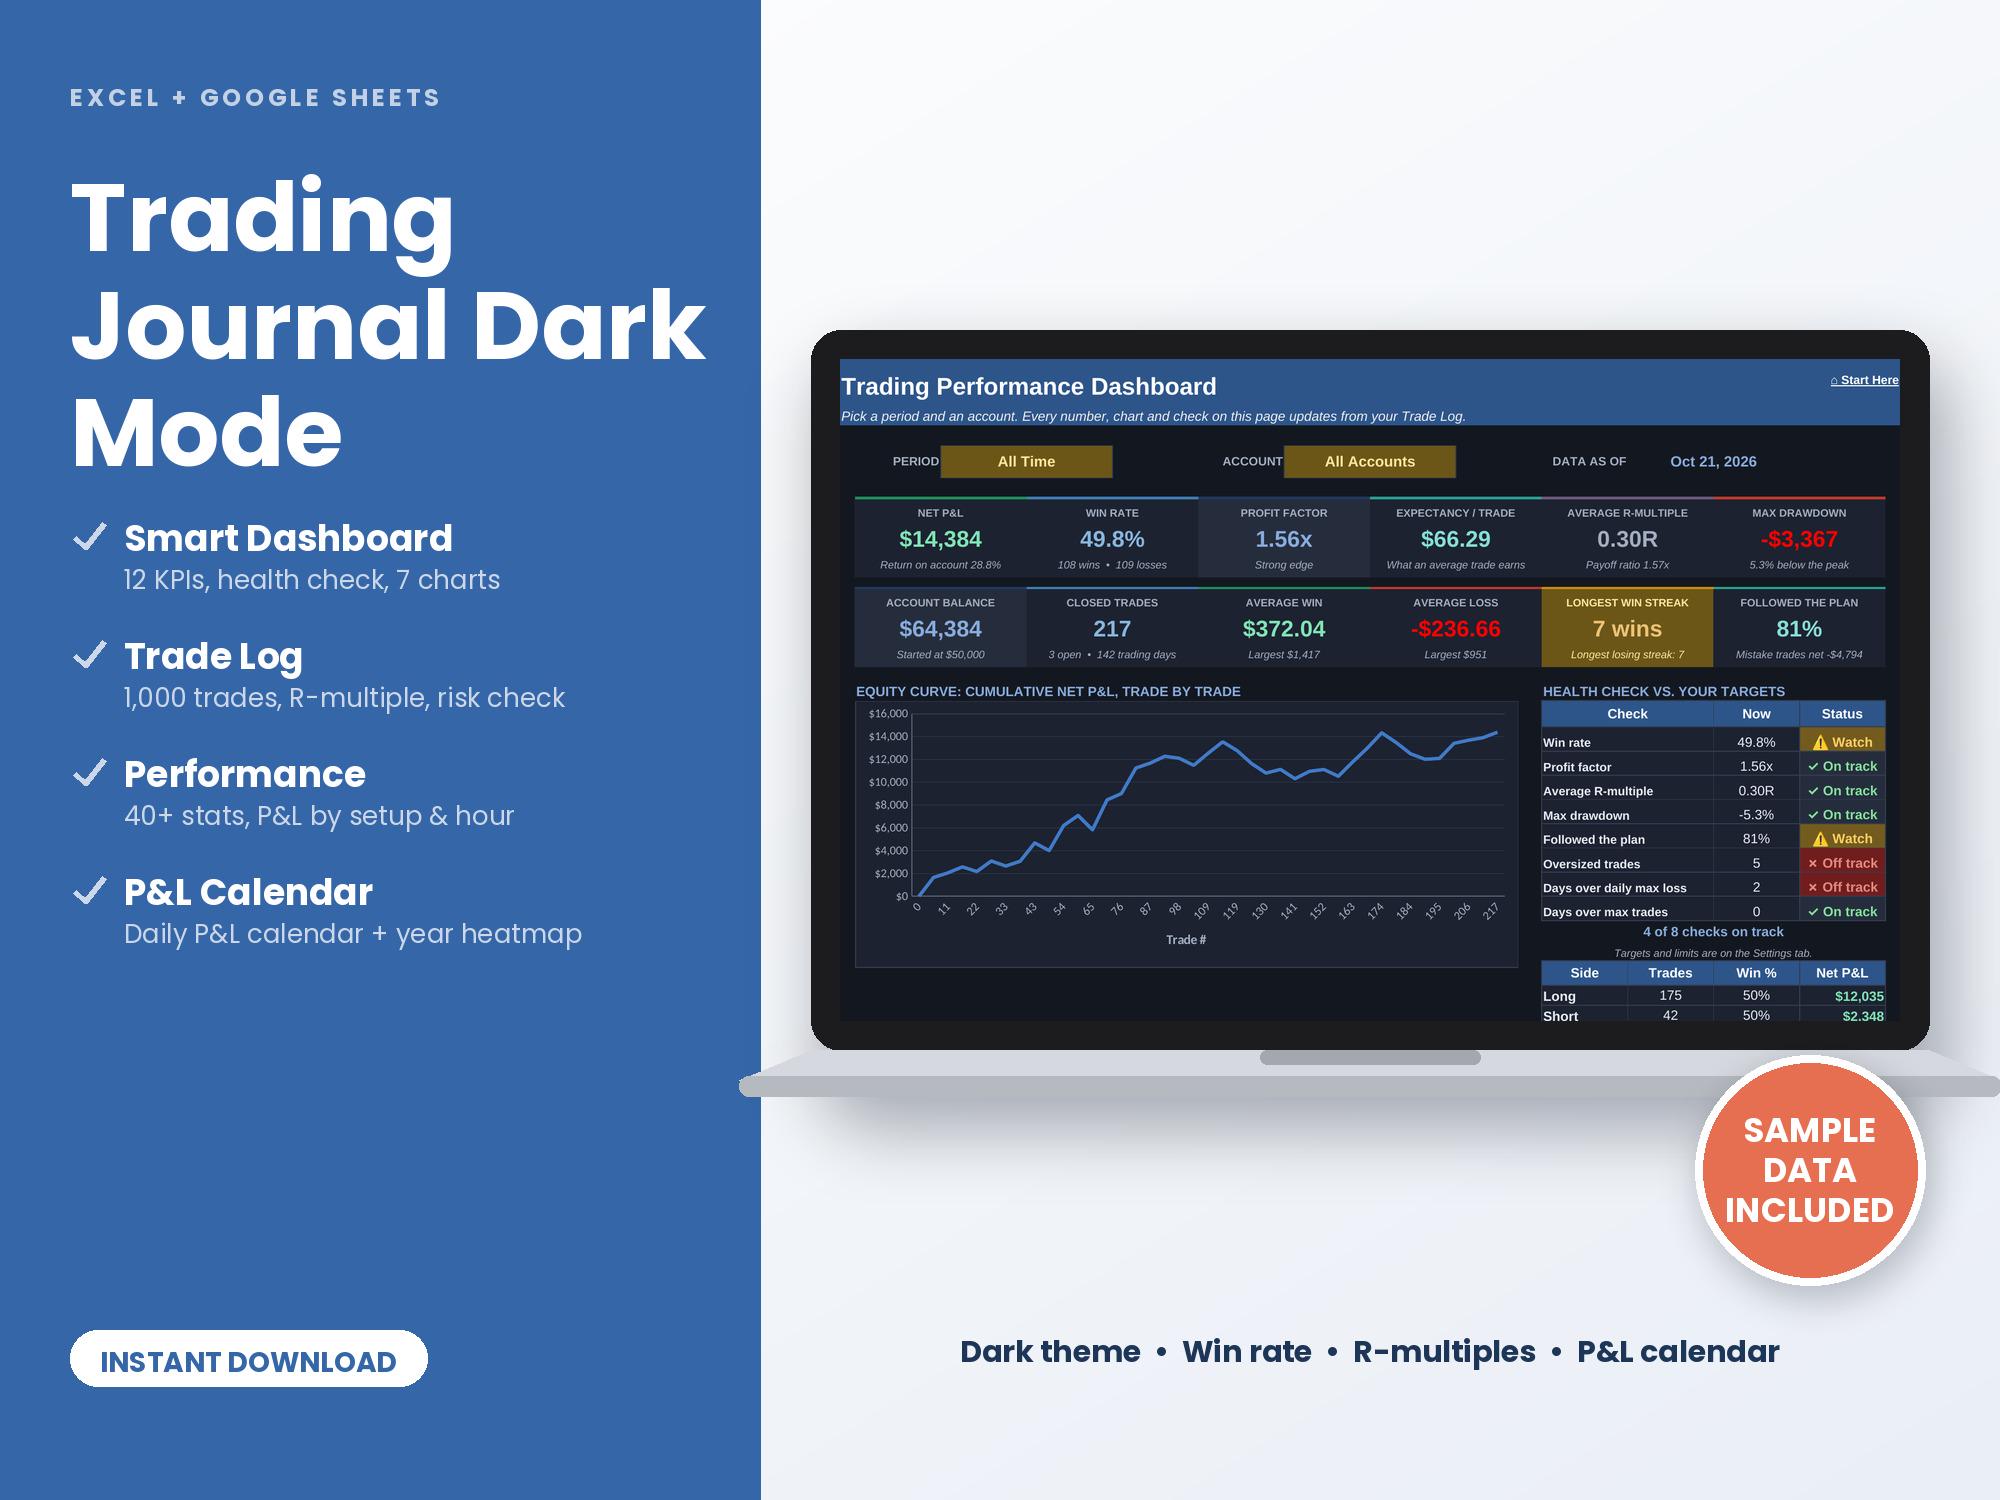
• Dashboard with Period and Account drop-downs (All Time, Report Year, This Month, Last 30 Days, Last 90 Days, Year to Date) that filter every report
• 12 KPI tiles: net P&L, win rate, profit factor, expectancy per trade, average R-multiple, max drawdown, account balance, closed trades, average win, average loss, longest win streak and % of trades that followed your plan
• Health check: 8 status flags against your own targets and limits (win rate, profit factor, average R, drawdown, plan followed, oversized trades, days over your daily max loss, days over your max trades)
• 7 dashboard charts: equity curve, drawdown from peak, monthly net P&L, top setups, R-multiple distribution, P&L by weekday and P&L by time of day, plus your best and worst 5 trades and tickers
• Trade Log with room for 1,000 trades: date, time, account, ticker, market, long / short, strategy, setup, entry, exit, quantity, multiplier (options and futures), stop, target, fees, exit date, mistake tag, followed plan, emotion, grade and notes. Open trades are supported
• Calculated for every trade: net P&L after fees, % return, $ risked, R-multiple, planned reward:risk, days held, running balance and a risk check (OK / Too big / No stop)
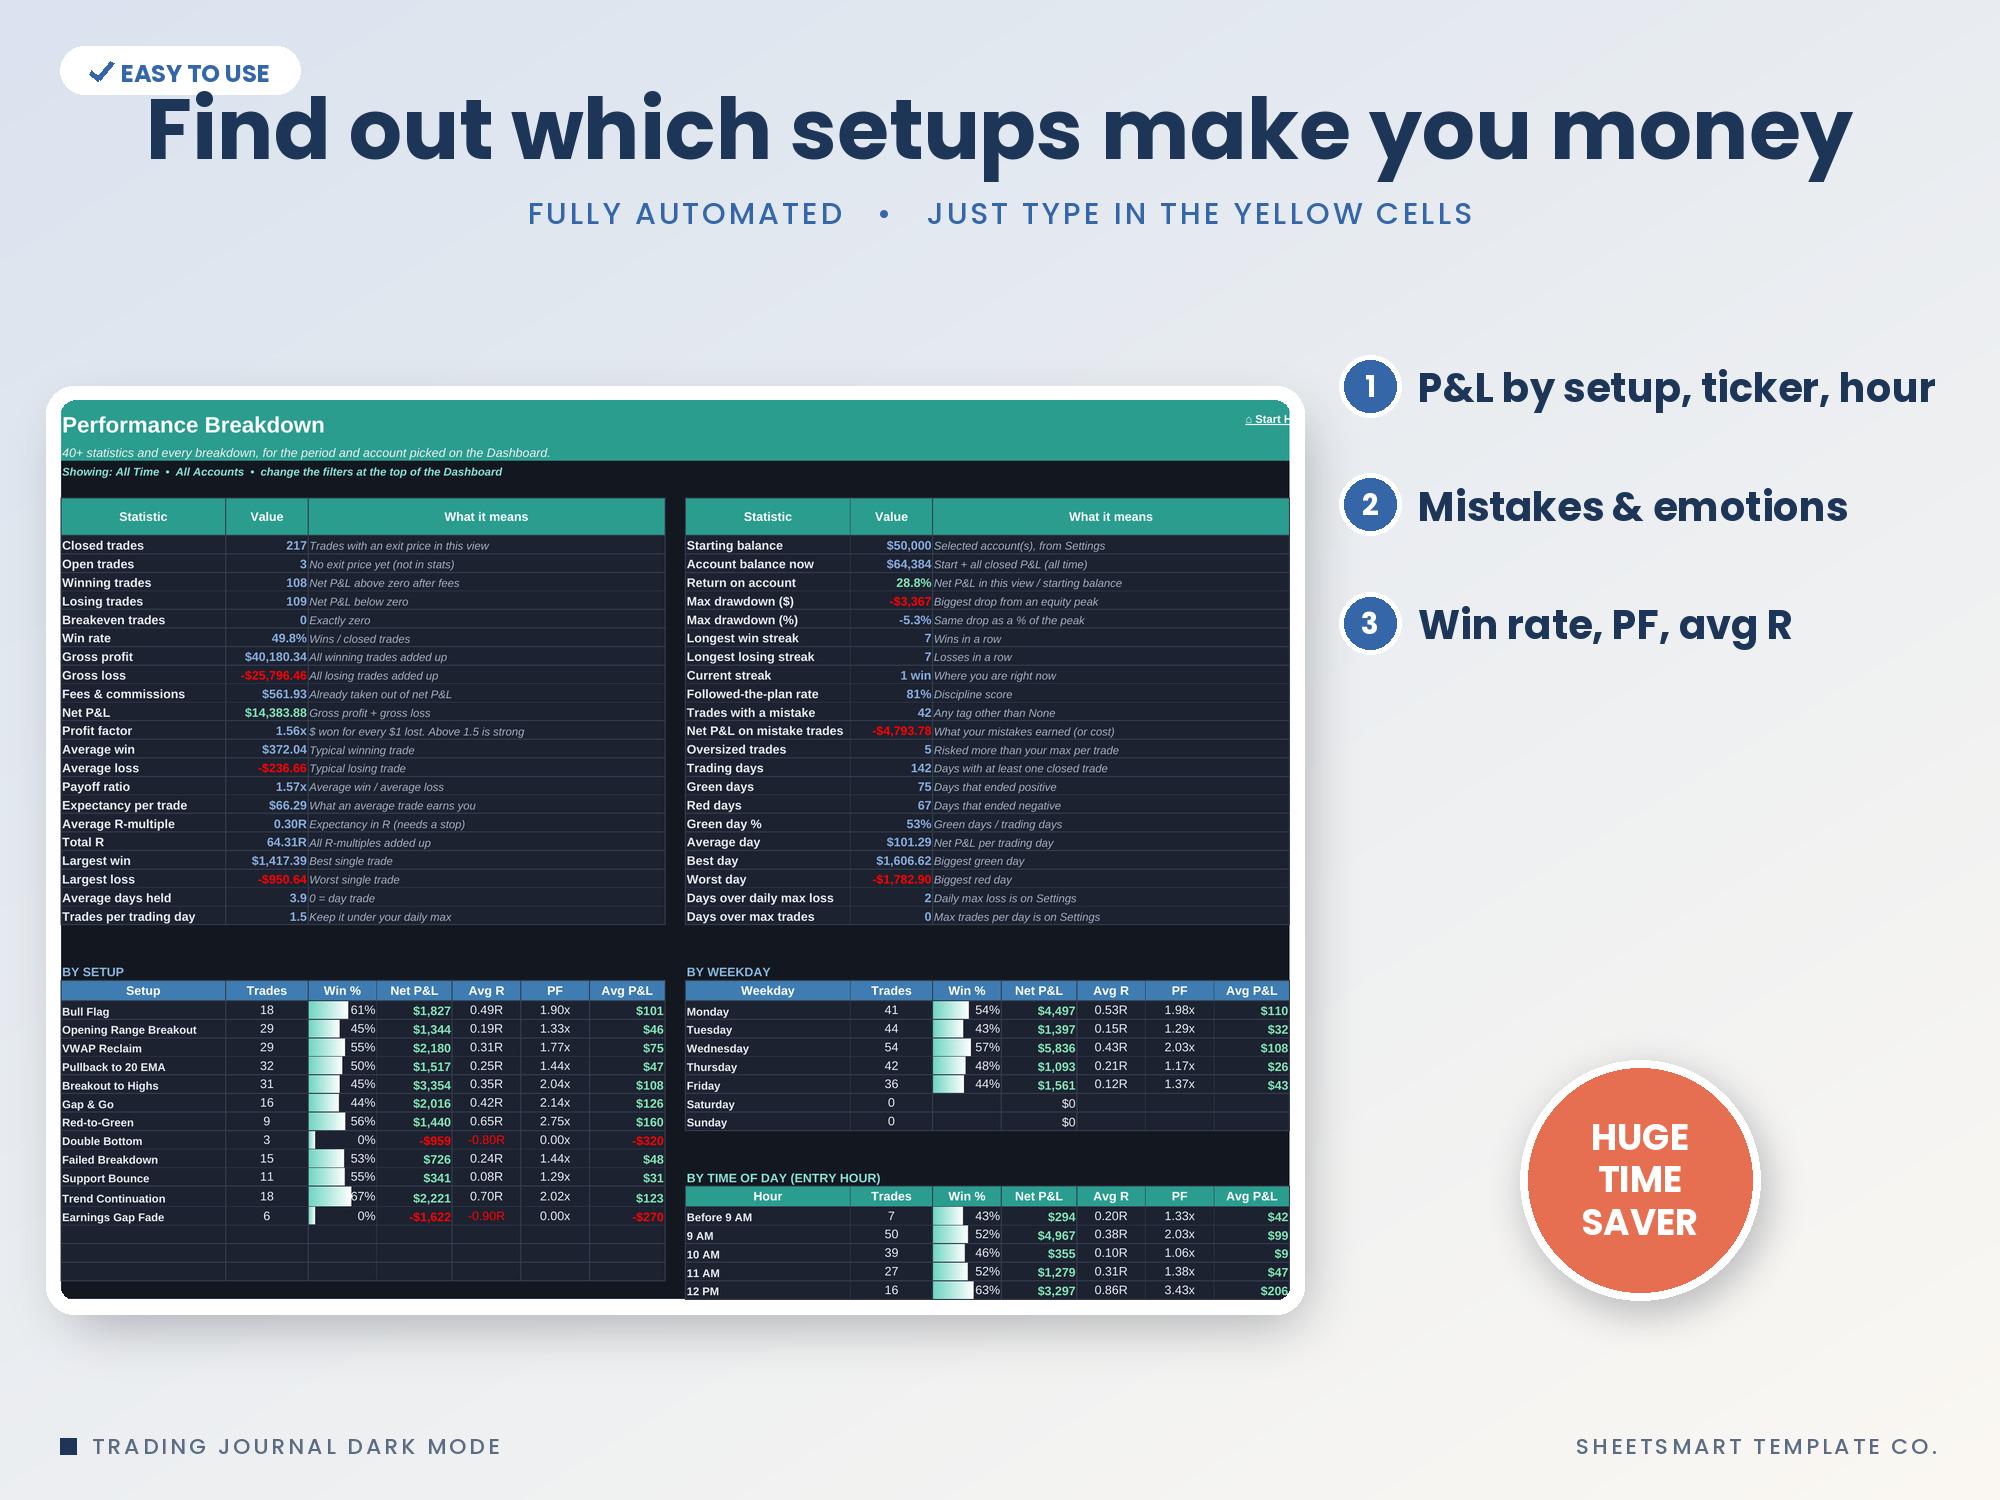
• Performance tab: 42 statistics explained in plain English, plus P&L, win rate, average R, profit factor and average P&L by setup, strategy, mistake tag, emotion, ticker, weekday, hour of entry, long vs. short, market, account, holding period, grade and plan followed
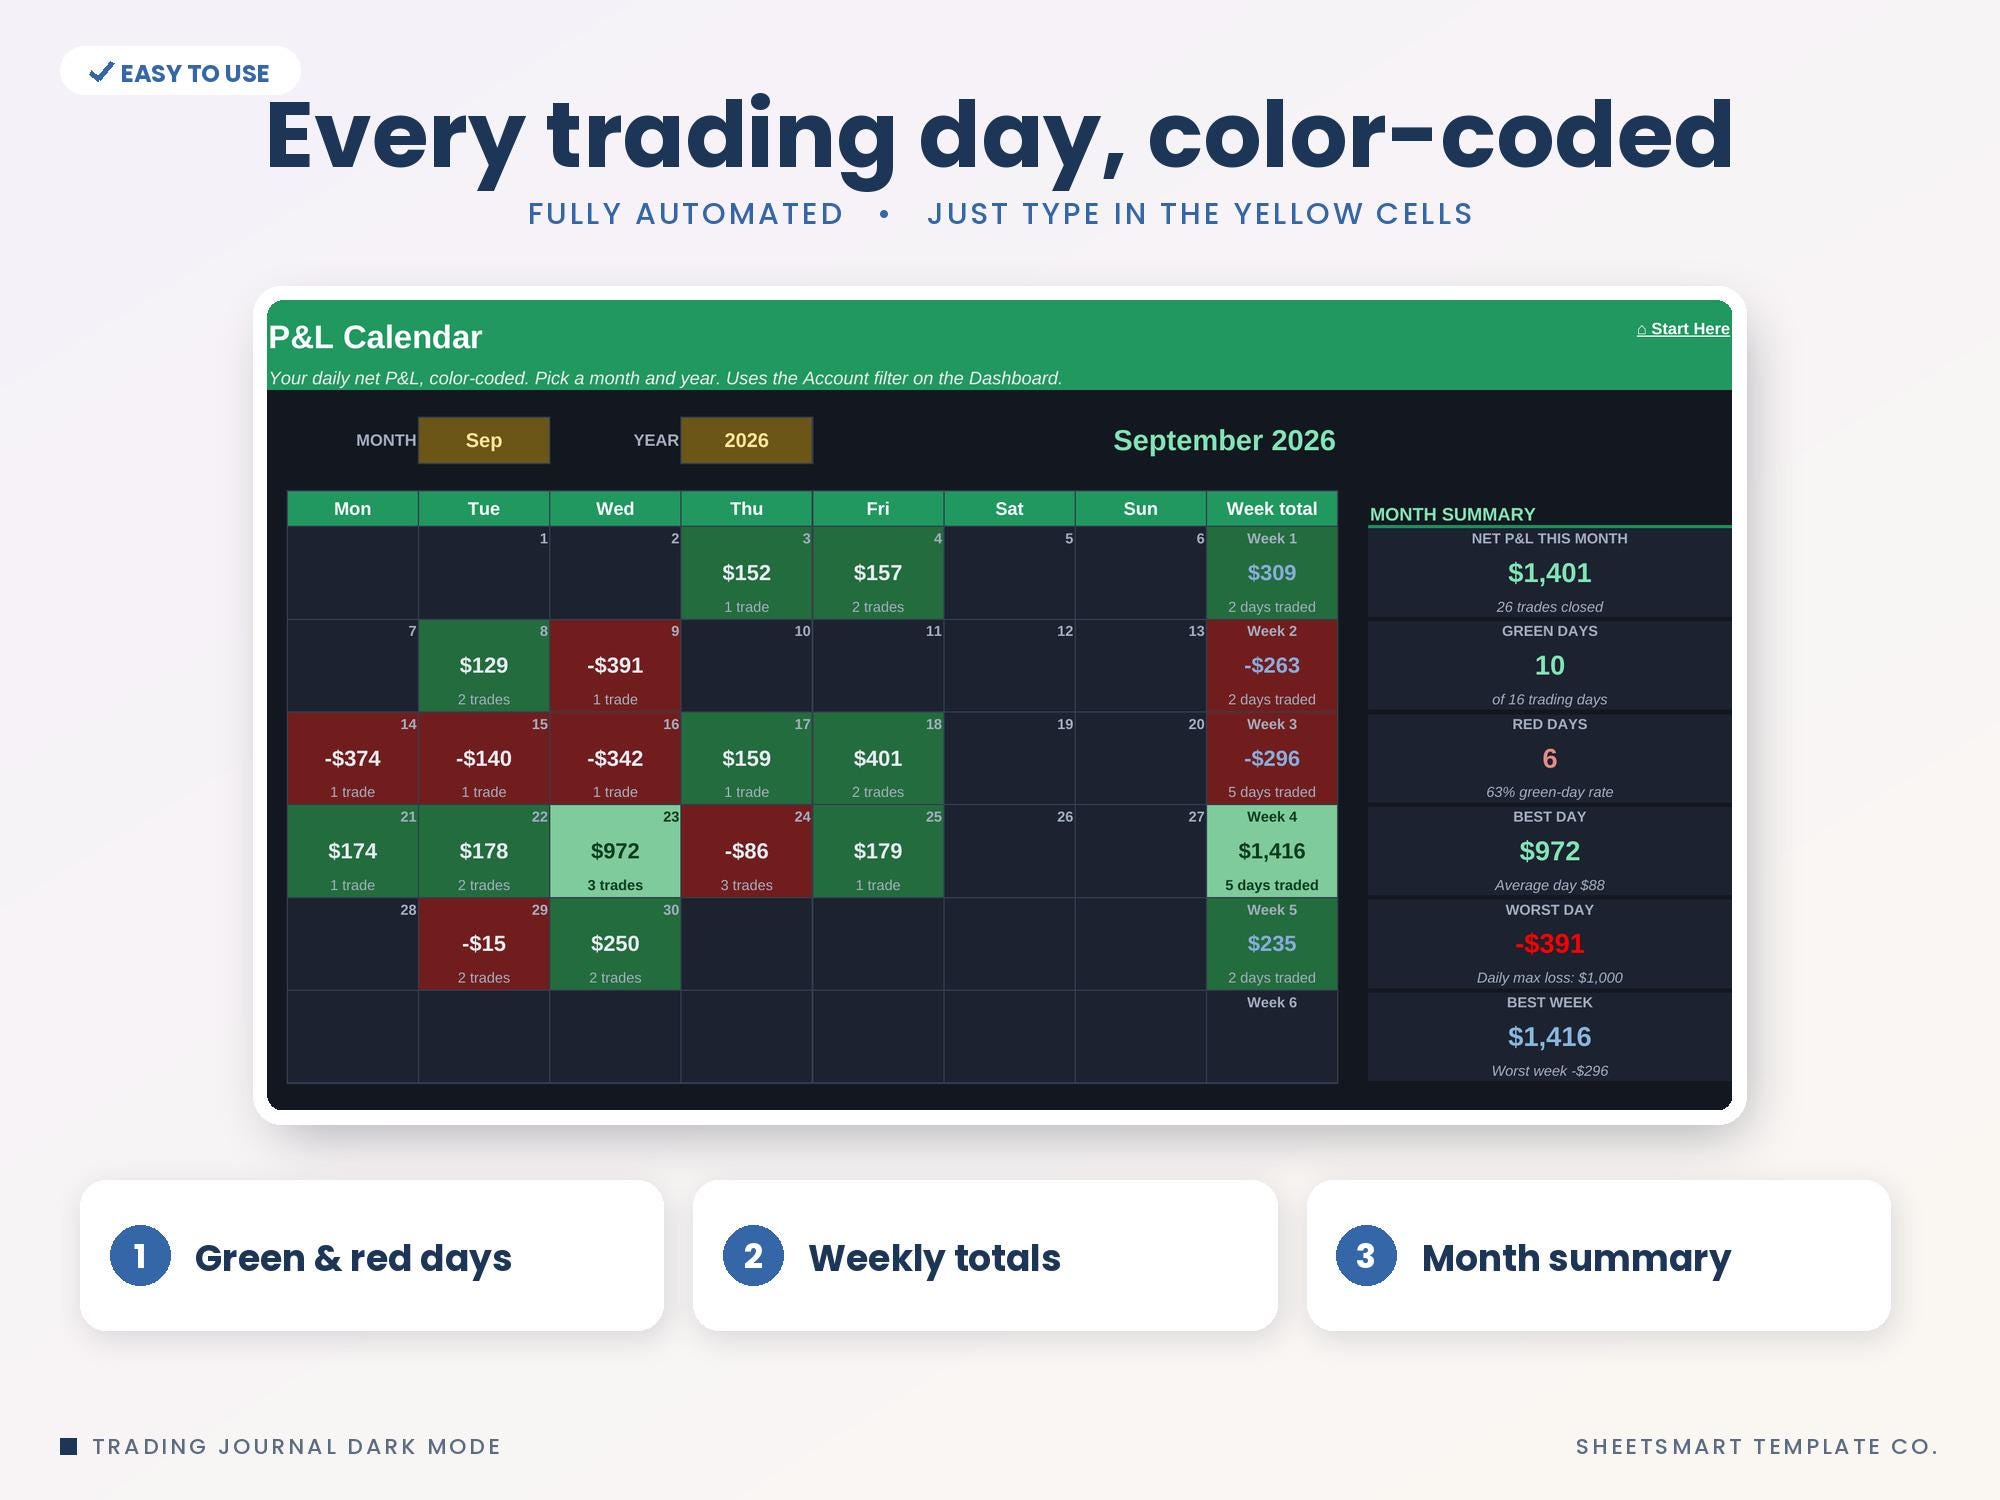
• P&L Calendar: pick any month to see each day's net P&L color-coded green / red, weekly totals and a month summary
• Year Heatmap: every trading day of the year in one color-coded grid with monthly totals and green / red day counts
• Monthly Review: pick a month for stats, week-by-week results, a daily P&L chart, setups and mistakes that month and space for your review notes
• Annual Review: 12 months side by side (trades, win rate, gross profit and loss, fees, net P&L, profit factor, average R, running total, return, plan followed, notes), a 5-year history and 3 charts
• Strategy Playbook: write the entry, stop, exit and best conditions for each setup and see its live stats, an A to D grade and a keep / refine / pause verdict
• Position Size & Risk calculator: shares or contracts to buy from your entry, stop and risk %, reward:risk, break-even win rate, a risk ladder, pri
Free Monthly Budget Starter Kit
5 printable pages: a monthly budget sheet, a 12-month bill checklist and 3 savings-goal trackers. Free when you join the email list.
Get the free kit